The effect of AI in journalism and politics
The effect of AI in journalism and politics
Source: page-034.txt

The University of South Carolina AI Index / JULY 2024
 33


THE EFFECT OF AI IN
JOURNALISM AND POLITICS
The survey indicates a divided outlook on AI's influence on the
quality of journalism, with positive influence for 46%, negative
influence for 36%, and no significant impact - for 18%.
Interestingly, skepticism about AI's role in journalism increases
with higher education levels and age, suggesting that more
educated and older respondents are more cautious about the
potential negative effects of AI on journalistic quality.
Source: page-035.txt
The University of South Carolina AI Index / JULY 2024
 34

However, the overall sentiment remains somewhat positive, with a larger portion of the
population leaning towards the belief that AI will enhance rather than undermine journalism
quality.

Figure 33 Source: Summer 2024 USC AI Index. Questions about the AI tools and the quality of journalism

When discussing the impact of AI on specific areas, the survey results reveal mixed opinions
among the public.

12%
34%
23%
13%
18%
0%
5%
10%
15%
20%
25%
30%
35%
40%
Strongly influences for
the better
Moderately influences
for the better
Moderately influences
for the worse
Strongly influences for
the worse
No significant impact
T o what extent do you believe AI can influence the
quality of journalism for better or for worse?
Source: page-036.txt
The University of South Carolina AI Index / JULY 2024
 35

Figure 34 Source: Summer 2024 USC AI
Index. Question - To what extent AI do you
think can contribute to online
misinformation and disinformation?
The concern about AI increasing
online misinformation is
evident, with 46% believing that
AI will heighten misinformation.
Conversely, 33% think AI might
reduce misinformation, while
21% believe AI's impact will be
neutral. The trend shows that
younger respondents feel less
at risk from misinformation,
potentially indicating a gap in
awareness about the dangers of
AI-generated content. Educated
individuals, on the other hand,
show greater apprehension about the rise of misinformation due to AI.

Figure 35 Source: Summer 2024 USC
AI Index. Question - Do you believe
that AI-generated content has the
potential to influence political
views, especially in the context of
future elections?
A significant portion of
respondents believe AI-
generated content could
influence political views,
particularly in the context of
future elections.
Specifically, 61% (37%
"probably yes" and 24%
"definitely yes") think it has
this potential. Only a small
fraction, 13%, dismiss this
possibility ("definitely not"
and "probably not"). Again, notably, younger individuals feel less exposed to the influence of AI-
generated content on political views, possibly making them more vulnerable to subtle
manipulations. In contrast, those with higher education levels are more aware and concerned
about such influences.
These insights underline the complexity of public perceptions regarding AI's role in influencing
information and politics. They highlight the need for heightened awareness and education,
especially among younger demographics, to better navigate the potential pitfalls of AI in
shaping opinions and disseminating information.
3%
10%
37%
24%
26%
0%
5%
10%
15%
20%
25%
30%
35%
40%
Definitely not Probably not Probably yes Definitely yes Neutral
Potential to influence political views
33%
46%
21%
0%
5%
10%
15%
20%
25%
30%
35%
40%
45%
50%
Reduces dis &
misinformation
Increases dis &
misinformation
AI has a neutral effect
Contribution to the
misinformation and
disinformation
Source: page-037.txt
The University of South Carolina AI Index / JULY 2024
 36
Also, public perceptions on the government's role in regulating AI tools like ChatGPT are
notably mixed. According to the survey, 26% worry that the government might over-regulate,
potentially stifling innovation and the beneficial applications of AI. The self-labeled Republicans
are even more concerned than the average American (40%).
Conversely, 38% of respondents are concerned that the government will not go far enough in
regulating the use of AI, indicating a desire for more stringent oversight to manage potential
risks and ethical considerations. Self-labeled Democrats are interested in a higher regulation in
proportion of 48%.

Figure 36 Source: Summer 2024 USC AI Index. Question - As chatbots like ChatGPT become more widespread, which is your
greater concern of the following?

20%
40%
26%
32%
29%
36%
48%
31%
38%
0% 10% 20% 30% 40% 50% 60% 70% 80% 90% 100%
Democrat
Republican
AVERAGE SAMPLE
Government will go too far regulating their use
Neither. I am not sure
Government will not go far enough regulating their use
Confidence in institutions & MEDIA
Source: page-038.txt
The University of South Carolina AI Index / JULY 2024
 37
CONFIDENCE IN INSTITUTIONS  & MEDIA

Figure 37 Source: Summer 2024 USC AI Index. Questions about the level of confidence in institutions. Results are presented
in order of the average score (higher average in top)

The data on institutional trust shows a clear hierarchy, with universities enjoying the
highest levels of confidence from the public, followed by YouTube, news websites, and
10%
8%
10%
12%
9%
5%
9%
13%
10%
10%
11%
14%
14%
8%
12%
11%
12%
14%
16%
16%
19%
18%
21%
20%
17%
24%
22%
28%
27%
29%
34%
36%
35%
30%
44%
40%
40%
41%
37%
27%
25%
20%
27%
26%
26%
23%
17%
19%
17%
20%
19%
15%
33%
28%
33%
20%
18%
16%
17%
21%
9%
13%
9%
9%
10%
0% 10% 20% 30% 40% 50% 60% 70% 80% 90% 100%
TikTok
X or Twitter
The Republican Party
Facebook
The Government
Major Corporations
The press
The Democratic Party
Business in general
Television news
News websites
YouTube
Universities
Level of confidence in institutions
A great deal Quite a lot A moderate amount Not very much No confidence at all
Source: page-039.txt
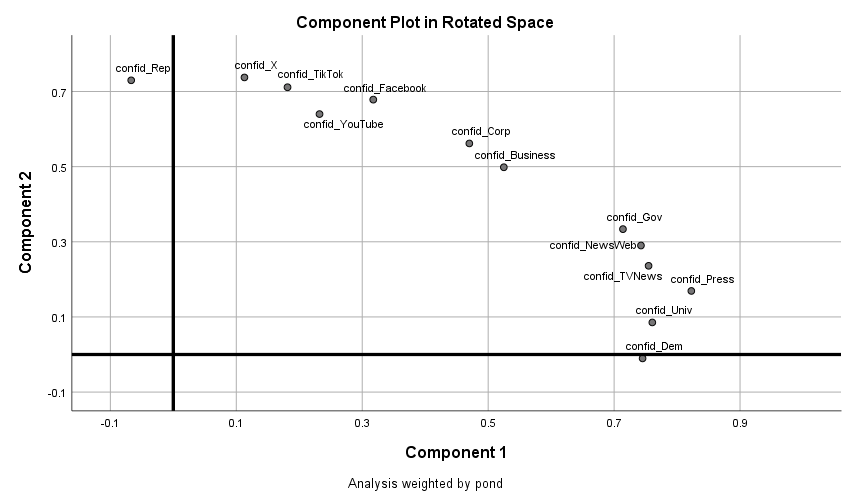
The University of South Carolina AI Index / JULY 2024
 38
television news. Conversely, TikTok is at the bottom of the trust scale, indicating
significant skepticism about this platform. Among social media channels, YouTube
stands out as the most trusted, reflecting its perceived reliability and influence.

The principal component analysis (PCA) in the second graph further elucidates the
public's trust patterns. It reveals distinct clusters of trust in various institutions. This
analysis helps understanding the underlying patterns of trust among different
demographic groups. For instance, there are clear divisions between those who trust
traditional institutions like universities, TV news, and government and those who place
their trust in newer, digital platforms like X, TikTok or YouTube. The PCA plot provides a
visual representation of these trust dynamics, highlighting the diverse trust profiles
within the surveyed population.

Figure 38 A Principal Component Analysis (PCA) of survey responses concerning trust in various U.S. institutions. Each point
represents an individual's trust levels, with the x-axis (PC1) capturing the most variance and the y-axis (PC2) showing the
second highest variance. Clusters indicate groups with similar trust profiles, while distances between points reflect
differences in trust levels. Institutions are depicted as vectors, showing their influence on the respondents' positions in the
PCA space. The length and direction of each vector indicate the strength and nature of the relationship between trust in that
institution and the principal components. This visualization reveals underlying patterns and distinct trust profiles among
different demographic or psychographic groups.