Media use patterns
Media use patterns
Source: page-008.txt

The University of South Carolina AI Index / JULY 2024
 7


MEDIA USE PATTERNS
The survey results reveal insights into the online behaviors of the
U.S. population. Notably, the number of individuals who actively
create content online—those who write comments, post on
social media, or share links daily or multiple times a day—stands
consistently at around 26-27%. This suggests a segment of the
audience that engages in proactive participatory behavior,
contributing content regularly.
Source: page-009.txt
The University of South Carolina AI Index / JULY 2024
 8

Figure 2 Source: Summer 2024 USC AI Index. Question - How often in the last week did you ... (read news, read comments,
write comments, post on social media, share links)

In contrast, the audience that consumes information is significantly larger. Approximately 48-
61% of respondents read news on digital platforms or read comments on social media daily or
multiple times a day. This indicates a substantial portion of the population that engages
primarily as consumers of content rather than creators.
This distinction between content creators and content consumers highlights different levels of
engagement within the digital landscape. While a dedicated minority drives much of the user-
generated content, a larger group consistently seeks out and consumes this information.
Understanding these dynamics is crucial for comprehending the broader patterns of online
interaction and information dissemination. The audience that generates communication
content consistently (daily or multiple times a day) tends to be younger, with lower educational
attainment, and lower income levels compared to the average sample. Additionally, this group
is more likely to self-identify with political affiliations as either Democrat or Republican. This
demographic insight underscores the proactive engagement of younger, less affluent
15%
34%
13% 14% 12%
23%
27%
13% 13% 14%
37%
26%
27%
31% 31%
13%
2%
7%
8% 9%
12% 11%
40%
34% 34%
0%
10%
20%
30%
40%
50%
60%
70%
80%
90%
100%
Read news on digital
platforms (websites,
social media, etc.)
Read comments on
articles or posts on
social media?
Write comments on
articles or posts on
social media?
Post on social media
or websites?
Share or forward
links to news articles
or posts on social
media?
Digital media use patterns in the US
Multiple times a day Daily From time to time Once Never
Source: page-010.txt
The University of South Carolina AI Index / JULY 2024
 9
individuals in creating online content, often aligning themselves more distinctly along political
lines.

Figure 3 Source: Summer 2024 USC AI Index. Question - Which of the following digital media platforms did you use to access
news in the last week? (Select all that apply / multiple choice)

The survey results, consistent with the findings of the Reuters Digital News Report 2024,
highlight that Facebook and YouTube are the leading platforms for accessing news among
Americans, with nearly half of the sample using these platforms regularly. It is noteworthy that
there is a higher-than-average proportion of younger audiences (under 35 years old) who rely on
most social media platforms for news. Conversely, older adults tend to prefer traditional news
websites.

8.9
9.4
11.5
12
12.4
14.1
21
24.8
28.1
39.9
48.6
49.2
Others (please specify)
Blogs or online forums
WhatsApp
Podcasts or audio platforms
LinkedIn
Reddit
X (former Twitter)
TikTok
Instagram
News websites
YouTube
Facebook
Facebook and Y ouT ube are the leading platforms for
accessing news among Americans
Source: page-011.txt
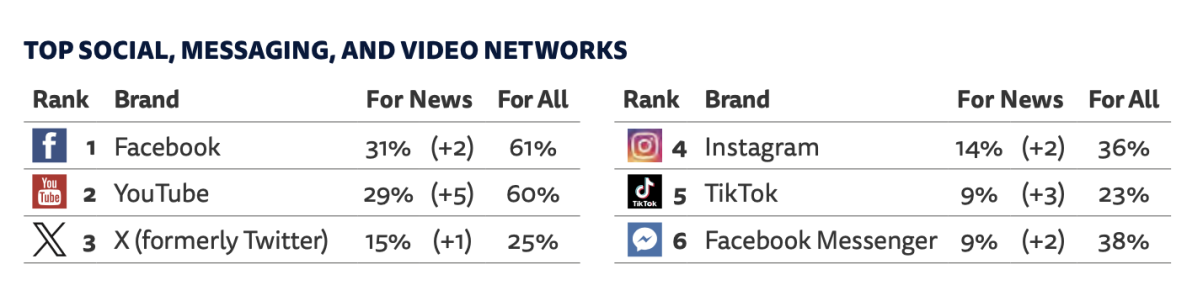
The University of South Carolina AI Index / JULY 2024
 10

Figure 4 Source - Reuters Digital News Report 2024, details about the US media use, indicating that Facebook and YouTube
are the platforms mostly used for news in the US (https://reutersinstitute.politics.ox.ac.uk/digital-news-report/2024)

Interestingly, the age distribution of those using Facebook for news mirrors the overall sample's
age structure, indicating that Facebook's relevance is not diminished among younger users.
This broad appeal underscores Facebook's continued significance as a news source across
various age groups. Thus, while younger audiences dominate the user base for platforms like
YouTube, Instagram, TikTok, and Reddit, traditional news websites and Facebook maintain a
balanced appeal across different age demographics, ensuring a diverse range of users access
news through these channels.


Figure 5 Source: Summer 2024 USC AI Index. Question - What is your main reason for posting on social media or websites?
(Select all that apply)
11%
12%
14%
14%
17%
20%
24%
44%
48%
0% 10% 20% 30% 40% 50% 60%
For personal branding or building a professional network
To promote a business, products, or services
Other (please specify)
To educate or provide tutorials on specific topics
To participate in social or political activism
As a creative outlet or hobby
To entertain or engage with an audience
To share information or personal opinions
To connect with others who have similar interests
The primary motivation for using social media and
digital platforms: connecting with others
Source: page-012.txt
The University of South Carolina AI Index / JULY 2024
 11
The survey highlights that the primary motivation for using social media and digital platforms is
driven by social objectives, such as connecting with others who share similar interests (48%)
and sharing information or personal opinions (44%). Additionally, a significant portion of users
(24%) engage with these platforms for entertainment purposes. These findings are neither new
nor surprising, reinforcing the well-established understanding of social media's role in fostering
connections, discussions, and entertainment.
Science & AI
Source: page-013.txt
The University of South Carolina AI Index / JULY 2024
 12
SCIENCE & AI


Figure 6 Source: Summer 2024 USC AI Index. Question - Overall, would you say science has had a mostly positive effect on
our society or a mostly negative effect on our society?
The survey results reveal a strong consensus that science has a predominantly positive impact
on society. A significant 78% of respondents view science as having either an extremely positive
(38%) or somewhat positive (40%) effect. In contrast, only a small fraction, 5%, perceive
science as having a somewhat negative (4%) or extremely negative (1%) impact. Additionally,
17% of respondents believe that science has neither a positive nor negative effect on society.
Notably, the level of education increases the likelihood of respondents considering science to
have a positive effect.

Figure 7 Source: Summer 2024 USC AI
Index. Question - Overall, would you
say science has had a mostly positive
effect on our society or a mostly
negative effect on our society?
Responses for each ideological
group.
Interestingly, there are no
significant differences in
perception between those
who identify as Democrats
or Republicans. However, it
is worth noting that the small
number of Republicans who
view science negatively is
significant and higher than
38% 40%
4%
1%
17%
0%
5%
10%
15%
20%
25%
30%
35%
40%
45%
Extremely positive Somewhat positive Somewhat negative Extremely negative Neither positive nor
negative
A strong consensus that science has a predominantly
positive impact
81%
74%
86%
3%
11%
2%
16%
16%
12%
0% 20% 40% 60% 80% 100%
Independent
Republican
Democrat
Small differences between
Democrats and Republicans
positive effect negative effect Neither positive nor negative
General perceptions about AI
Source: page-014.txt
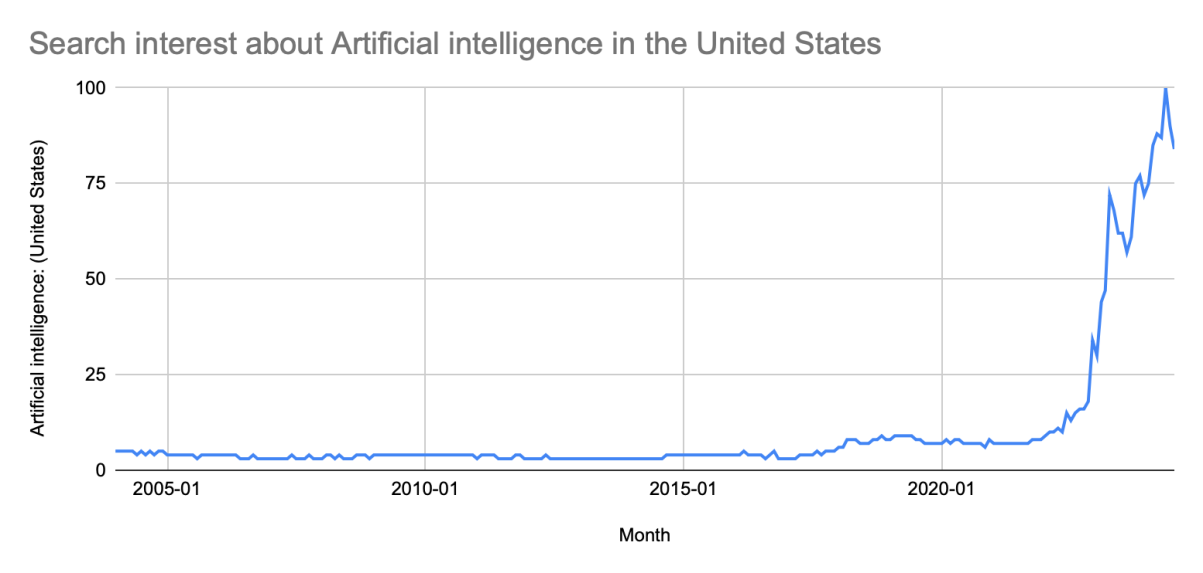
The University of South Carolina AI Index / JULY 2024
 13
the number of Democrats holding the same view.

GENERAL PERCEPTIONS ABOUT AI

Figure 8 Source: Summer 2024 USC AI Index.
Question - How much have you heard or read about
AI?
Despite the topic's omnipresence in
the media and the increased search
activity surrounding it, 31% of
respondents have either not heard at
all (6%) or have heard only a little (25%)
about AI. The survey results indicate
that only a minority of the population
(36%) acknowledges having heard a
significant amount about artificial
intelligence (AI). In comparison, 33%
report having heard a moderate amount. These findings suggest that, although AI is widely
discussed, a substantial portion of the population remains relatively uninformed about it.


Figure 9 The intensity of searches related to artificial intelligence (AI) has increased dramatically and exponentially in the
United States since November 2022, coinciding with the public launch of ChatGPT. Data provided by Google Trends clearly
illustrates this surge, reflecting a growing interest and curiosity about AI technologies among the American public.
6%
25%
33%
14%
22%
0%
5%
10%
15%
20%
25%
30%
35%
Not at all A little A
moderate
amount
A great
deal
A lot
Only a minority have heard
something about the AI
Source: page-015.txt
The University of South Carolina AI Index / JULY 2024
 14

Figure 10 Source: Summer 2024 USC AI
Index. Question - Overall, would you say
technology like Artificial Intelligence has had
a mostly positive effect on our society or a
mostly negative effect on our society?
The survey results regarding the
societal impact of artificial
intelligence (AI) technology
present a nuanced perspective. A
majority of respondents, 47%,
believe that AI has had a positive
effect on society, with 13%
considering it very positive and
34% somewhat positive.
However, 26% of respondents are
neutral, seeing AI's impact as
neither positive nor negative. On the other hand, 27% of respondents view AI's impact
negatively, with 20% identifying it as somewhat negative and 7% as very negative. These results
reflect a divided opinion on AI, and the age difference is essential in this division. Younger
respondents are more likely to view artificial intelligence (AI) as having a positive effect on
society compared to older age groups. Among the 18-24-year-olds, 57% believe AI has a
positive impact. In contrast, only 35% of respondents aged 65 and older share this positive
view.

Figure 11 Source: Summer 2024 USC AI Index. Question - Overall, would you say technology like Artificial Intelligence has
had a mostly positive effect on our society or a mostly negative effect on our society?
57% 62%
45% 55%
36% 35%
25% 17%
25% 21%
33% 38%
18-24 years old 25-34 years old 35-44 years old 45-54 years old 55-64 years old 65+ years old
As age increases, the perception of AI's negative
effects also rises
Subtotal: POSITIVE Subtotal: NEGATIVE
13%
34%
26%
20%
7%
0%
5%
10%
15%
20%
25%
30%
35%
40%
Very
positive
effect
Somewhat
positive
effect
Neither
positive or
negative
Somewhat
negative
effect
Very
negative
effect
So far,  Artificial Intelligence has
had a mostly positive effect on
our society
Source: page-016.txt
The University of South Carolina AI Index / JULY 2024
 15
Older individuals are more skeptical about the benefits of AI, highlighting a generational divide
in attitudes towards this technology. Similarly, we observe differences in perception across
other categories. Negative perceptions of AI are more prevalent among individuals with lower
incomes and those without higher education. These groups are more likely to view AI's impact
as somewhat or very negative, suggesting that socioeconomic factors play a significant role in
shaping attitudes towards AI.


Figure 12 Source: Summer 2024 USC AI Index.
Question - Overall, would you say the increased use
of artificial intelligence tools in daily life makes you
feel…
The survey reveals mixed feelings about
the increased use of artificial
intelligence (AI) tools in daily life. While
48% of respondents feel equally
concerned and excited, 35% are more
concerned than excited. These
concerns increase with age, lack of
education, and economic disparities,
highlighting the need to address these
issues to foster a more balanced
perspective on AI in the future. Only
17% of respondents feel more excited than concerned.


17%
48%
35%
0%
10%
20%
30%
40%
50%
60%
More excited than
concerned
Equally concerned
and excited
More concerned
than excited
Mixed feelings about the
increased use of AI