Category: Wave 1

  • Summary

    Executive Summary

    The University of South Carolina AI Index 2024, conducted by the College of Information and Communications provides a new perspective and new
    analysis of the use and perception of artificial intelligence (AI) in
    communication within the United States. The survey, which gathered
    responses from 1061 U.S. residents, highlights insights into AI’s impact on
    news consumption, social media engagement and professional
    communication tasks.


    Key Findings
    1. Awareness and Perception of AI
    Despite the increased media coverage, 31% of respondents have limited awareness of
    AI, with 6% having no knowledge and 25% only a little. Conversely, only 36% report
    significant familiarity with AI technologies.
    There is a generational divide in AI awareness: younger individuals (18-24) are more
    knowledgeable about AI tools like ChatGPT compared to older age groups.

    2. AI in Professional and Academic Settings
    38% of respondents have utilized AI tools for work or study, with higher usage reported
    among younger individuals, those from the Western U.S., and those with medium to
    high income levels. The primary barriers to AI adoption include a lack of trust (46%) and
    skills (24%), overshadowing financial concerns. Among the predictors, social media
    engagement shows a strong positive association with AI assistant usage. Individuals
    who are more engaged on social media are significantly more likely to use AI assistants.
    Age has a notable negative effect on the likelihood of using AI assistants: older people
    are less likely to use AI assistants than younger people. Education level is positively
    correlated with usage: higher education levels increase the probability of using AI
    assistants. Income similarly shows a positive and significant correlation. Political
    engagement, irrespective of the specific orientation, is associated with increased AI
    assistant usage. Trust in universities also has a positive impact on the likelihood of
    using AI assistants.

    3. Impact on Productivity and Challenges
    The survey reveals that ChatGPT is by far the most well-known and widely used AI tool.
    Its usage is double that of Google Gemini and nearly triple that of Microsoft Copilot.
    AI tools are perceived to enhance productivity, with Microsoft Copilot users reporting
    the highest improvement rates (76%), followed by Google Gemini users (75%), and
    ChatGPT users (68%).

    Source: page-005.txt

    The University of South Carolina AI Index / JULY 2024 
     4 
    Key challenges in using AI include handling complex requests and ensuring accuracy, 
    with 13% of users noting frequent corrections needed. 
    4. AI in Content Creation 
    71% of professionals in Communication and Media use AI for content creation. Daily 
    usage is high among these professionals. AI tools are also widely used in Science and 
    Engineering (47%), Services (50%), and Finance (36%). 
    5. Ethical and Privacy Concerns 
    Only 27% of respondents are aware of ethical guidelines for AI use in their field. Ethical 
    concerns are more prevalent among women and those with higher education levels. 
    Privacy issues have been encountered by 12% of users, highlighting the need for robust 
    ethical frameworks and user education. 
    6. The influence over Journalism 
    Public opinion on AI's role in journalism is divided: 46% see a positive influence, 36% 
    see a negative impact. 46% fear AI increases misinformation, though 33% believe AI 
    could help reduce it. Higher trust in the press and universities is associated with a more 
    positive perception of AI's impact on journalism.  
    Belief that AI influences political views correlates with a more negative perception of its 
    impact on journalism. 
    The perception that AI increases the spread of misinformation has a strongly negative 
    correlation, suggesting that concerns about misinformation are associated with a more 
    negative view of AI's impact on journalism. 
    7. Future of Jobs in Communication 
    52% fear job reductions due to automation, while 29% expect job transformation 
    requiring new skills. Older respondents are more skeptical about AI's impact on job 
    markets compared to younger individuals. Higher trust in science, government, and 
    universities corresponds to a lower likelihood of believing AI will reduce jobs. Social 
    media engagement correlates with fewer concerns about job reductions. There are 
    gender differences. Males are less likely than women to believe that AI will reduce jobs. 
    Higher income individuals are slightly less likely to believe that AI will lead to job 
    reductions. 
    Implications 
    Our findings underscore the need for increased AI literacy and trust-building measures. 
    The survey highlights the necessity for ethical standards and regulatory frameworks to 
    manage the integration of AI into communication. Understanding public perceptions 
    can guide policymakers and developers in creating balanced, inclusive AI strategies 
    that address societal concerns while maximizing technological benefits. The findings 
    from this survey can inform future developments in AI technology and its application in 
    the communication industry. In summary, this survey offers a comprehensive analysis 
    of AI's role in communication within the United States, providing critical insights that 
    can guide future advancements in this rapidly evolving field.

    About this initiative

    Source: page-006.txt

    Figure 1 line chart showing U.S. interest in generative AI tools over recent years
    Figure 1. Interest in different forms of Generative AI in the U.S. in recent years (Google Trends data).
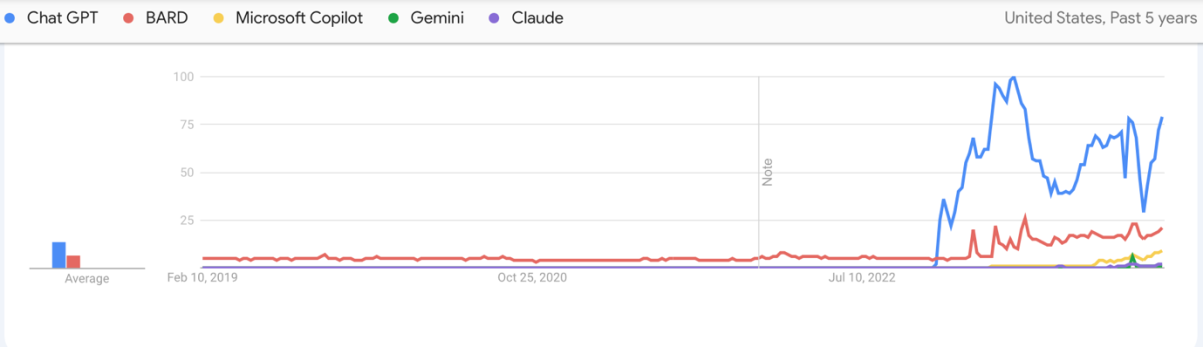
    The University of South Carolina AI Index / JULY 2024 
     5 
     
    ABOUT THIS INITIATIVE  
     
    This research initiative is aimed at understanding the utilization and impact of some 
    specific form of AI - large language models (LLMs), such as OpenAI's ChatGPT, Google's 
    Gemini (former Bard), and other AI specialized in generative AI for communication, on 
    content creation and communication practices in the United States. Through a 
    biannual national survey, supplemented by social media listening in a later phase, this 
    project examines the ways in which individuals and organizations leverage AI 
    technologies for various communication purposes. 
     
     
    Figure 1 Interest in different forms of Generative AI in the US, in the last years. Google Trends data 
     
    The College of Information and Communications at the University of South Carolina 
    intends to repeat this survey periodically to monitor the evolution of AI perceptions and 
    usage patterns over time. Future research will focus on tracking changes in public 
    sentiment, identifying emerging trends in AI adoption across different sectors, and 
    examining the long-term impacts of AI on communication practices. By continuously 
    gathering data, the college aims to provide valuable insights that can inform policy 
    decisions and technological advancements, ensuring that AI developments align with 
    societal needs and ethical considerations.

    How We Did This

    Source: page-007.txt

    The University of South Carolina AI Index / JULY 2024 
     6 
    HOW WE DID THIS  
     
    The AI Index explores various aspects of AI, including its impact on news consumption, social media 
    engagement, and professional tasks related to communication. It aims to gather data on the frequency of 
    AI tool usage, the types of tasks AI assists with, and the overall sentiment towards AI's role in 
    communication. 
    Survey Design and Coordination 
    This survey was designed by a team of experts led by Dr. Dan Sultanescu and Dr. Linwan Wu, from the 
    College of Information and Communications, University of South Carolina. The primary objective was to 
    measure the use and perception of artificial intelligence (AI) in communication within the United States.  
    We appreciate the support of Prof. Randy Covington and the expertise of the statistics and 
    communication specialists from the Social Monitor team in Romania, Dr. Dana Sultanescu and Dr. 
    Andreea Stancea, for their contributions. Additionally, we are grateful for the support and 
    encouragement from Dean Tom Reichert, whose assistance was instrumental in moving this project 
    forward and keeping us on track. 
    Methodology 
    The survey was conducted in the last week of June, 2024 using the Computer-Assisted Web Interviewing 
    (CAWI) method via the Qualtrics platform. A total of 1,061 complete responses were collected. It is 
    important to note that online samples tend to under-represent the opinions and behaviors of people who 
    are not online (typically those who are older, less affluent, and have limited formal education). Moreover, 
    because people usually opt in to online survey panels, they tend to over-represent people who are well 
    educated and socially and politically active. 
    Sampling and Data Collection 
    The survey sampled respondents across different age groups, genders, and regions in the United States. 
    It included individuals from various educational backgrounds and professional fields, ensuring a 
    comprehensive overview of AI usage and perceptions. 
    Weighting and Representativeness 
    The database was weighted to be representative of the U.S. voting population based on the most recent 
    U.S. Census data. Adjustments were made for age, gender, education, ethnicity/race, location, income, 
    and occupation type. These adjustments were relatively small, ensuring that the results accurately 
    reflect the population. 
    Data Analysis 
    For our data analysis, we started by weighting the database for representativeness. We then generated 
    descriptive statistics for all variables to understand the dataset better. Using crosstabulation, we 
    examined relationships between variables and identified significant patterns. We conducted exploratory 
    factor analysis to uncover underlying structures and tested these connections with correlation analyses. 
     
    We also built logistic regression models to identify significant influences on the use of AI tools, 
    perceptions of AI's impact on journalism, and concerns about AI's influence on journalism. This 
    approach allowed us to derive valuable insights into the factors shaping these opinions.

    Back to contents

  • Media use patterns

    Media use patterns

    Media use patterns

    Source: page-008.txt

    Section cover for media use patterns
    The University of South Carolina AI Index / JULY 2024 
     7 


    MEDIA USE PATTERNS  
    The survey results reveal insights into the online behaviors of the 
    U.S. population. Notably, the number of individuals who actively 
    create content online—those who write comments, post on 
    social media, or share links daily or multiple times a day—stands 
    consistently at around 26-27%. This suggests a segment of the 
    audience that engages in proactive participatory behavior, 
    contributing content regularly.

    Source: page-009.txt

    The University of South Carolina AI Index / JULY 2024 
     8 
     
    Figure 2 Source: Summer 2024 USC AI Index. Question - How often in the last week did you ... (read news, read comments, 
    write comments, post on social media, share links) 
     
    In contrast, the audience that consumes information is significantly larger. Approximately 48-
    61% of respondents read news on digital platforms or read comments on social media daily or 
    multiple times a day. This indicates a substantial portion of the population that engages 
    primarily as consumers of content rather than creators. 
    This distinction between content creators and content consumers highlights different levels of 
    engagement within the digital landscape. While a dedicated minority drives much of the user-
    generated content, a larger group consistently seeks out and consumes this information. 
    Understanding these dynamics is crucial for comprehending the broader patterns of online 
    interaction and information dissemination. The audience that generates communication 
    content consistently (daily or multiple times a day) tends to be younger, with lower educational 
    attainment, and lower income levels compared to the average sample. Additionally, this group 
    is more likely to self-identify with political affiliations as either Democrat or Republican. This 
    demographic insight underscores the proactive engagement of younger, less affluent 
    15%
    34%
    13% 14% 12%
    23%
    27%
    13% 13% 14%
    37%
    26%
    27%
    31% 31%
    13%
    2%
    7%
    8% 9%
    12% 11%
    40%
    34% 34%
    0%
    10%
    20%
    30%
    40%
    50%
    60%
    70%
    80%
    90%
    100%
    Read news on digital
    platforms (websites,
    social media, etc.)
    Read comments on
    articles or posts on
    social media?
    Write comments on
    articles or posts on
    social media?
    Post on social media
    or websites?
    Share or forward
    links to news articles
    or posts on social
    media?
    Digital media use patterns in the US
    Multiple times a day Daily From time to time Once Never

    Source: page-010.txt

    The University of South Carolina AI Index / JULY 2024 
     9 
    individuals in creating online content, often aligning themselves more distinctly along political 
    lines.  
     
    Figure 3 Source: Summer 2024 USC AI Index. Question - Which of the following digital media platforms did you use to access 
    news in the last week? (Select all that apply / multiple choice) 
     
    The survey results, consistent with the findings of the Reuters Digital News Report 2024, 
    highlight that Facebook and YouTube are the leading platforms for accessing news among 
    Americans, with nearly half of the sample using these platforms regularly. It is noteworthy that 
    there is a higher-than-average proportion of younger audiences (under 35 years old) who rely on 
    most social media platforms for news. Conversely, older adults tend to prefer traditional news 
    websites. 
     
    8.9
    9.4
    11.5
    12
    12.4
    14.1
    21
    24.8
    28.1
    39.9
    48.6
    49.2
    Others (please specify)
    Blogs or online forums
    WhatsApp
    Podcasts or audio platforms
    LinkedIn
    Reddit
    X (former Twitter)
    TikTok
    Instagram
    News websites
    YouTube
    Facebook
    Facebook and Y ouT ube are the leading platforms for 
    accessing news among Americans

    Source: page-011.txt

    Figure 4 table showing social, messaging, and video platforms used for news in the U.S.
    Figure 4. Reuters Digital News Report 2024: platforms mostly used for news in the U.S.
    The University of South Carolina AI Index / JULY 2024 
     10 
     
    Figure 4 Source - Reuters Digital News Report 2024, details about the US media use, indicating that Facebook and YouTube 
    are the platforms mostly used for news in the US (https://reutersinstitute.politics.ox.ac.uk/digital-news-report/2024) 
     
    Interestingly, the age distribution of those using Facebook for news mirrors the overall sample's 
    age structure, indicating that Facebook's relevance is not diminished among younger users. 
    This broad appeal underscores Facebook's continued significance as a news source across 
    various age groups. Thus, while younger audiences dominate the user base for platforms like 
    YouTube, Instagram, TikTok, and Reddit, traditional news websites and Facebook maintain a 
    balanced appeal across different age demographics, ensuring a diverse range of users access 
    news through these channels. 
     
     
    Figure 5 Source: Summer 2024 USC AI Index. Question - What is your main reason for posting on social media or websites? 
    (Select all that apply) 
    11%
    12%
    14%
    14%
    17%
    20%
    24%
    44%
    48%
    0% 10% 20% 30% 40% 50% 60%
    For personal branding or building a professional network
    To promote a business, products, or services
    Other (please specify)
    To educate or provide tutorials on specific topics
    To participate in social or political activism
    As a creative outlet or hobby
    To entertain or engage with an audience
    To share information or personal opinions
    To connect with others who have similar interests
    The primary motivation for using social media and 
    digital platforms: connecting with others

    Source: page-012.txt

    The University of South Carolina AI Index / JULY 2024 
     11 
    The survey highlights that the primary motivation for using social media and digital platforms is 
    driven by social objectives, such as connecting with others who share similar interests (48%) 
    and sharing information or personal opinions (44%). Additionally, a significant portion of users 
    (24%) engage with these platforms for entertainment purposes. These findings are neither new 
    nor surprising, reinforcing the well-established understanding of social media's role in fostering 
    connections, discussions, and entertainment.

    Science & AI

    Source: page-013.txt

    The University of South Carolina AI Index / JULY 2024 
     12 
    SCIENCE & AI  
     
     
    Figure 6 Source: Summer 2024 USC AI Index. Question - Overall, would you say science has had a mostly positive effect on 
    our society or a mostly negative effect on our society? 
    The survey results reveal a strong consensus that science has a predominantly positive impact 
    on society. A significant 78% of respondents view science as having either an extremely positive 
    (38%) or somewhat positive (40%) effect. In contrast, only a small fraction, 5%, perceive 
    science as having a somewhat negative (4%) or extremely negative (1%) impact. Additionally, 
    17% of respondents believe that science has neither a positive nor negative effect on society. 
    Notably, the level of education increases the likelihood of respondents considering science to 
    have a positive effect. 
     
    Figure 7 Source: Summer 2024 USC AI 
    Index. Question - Overall, would you 
    say science has had a mostly positive 
    effect on our society or a mostly 
    negative effect on our society? 
    Responses for each ideological 
    group. 
    Interestingly, there are no 
    significant differences in 
    perception between those 
    who identify as Democrats 
    or Republicans. However, it 
    is worth noting that the small 
    number of Republicans who 
    view science negatively is 
    significant and higher than 
    38% 40%
    4%
    1%
    17%
    0%
    5%
    10%
    15%
    20%
    25%
    30%
    35%
    40%
    45%
    Extremely positive Somewhat positive Somewhat negative Extremely negative Neither positive nor
    negative
    A strong consensus that science has a predominantly 
    positive impact 
    81%
    74%
    86%
    3%
    11%
    2%
    16%
    16%
    12%
    0% 20% 40% 60% 80% 100%
    Independent
    Republican
    Democrat
    Small differences between 
    Democrats and Republicans
    positive effect negative effect Neither positive nor negative

    General perceptions about AI

    Source: page-014.txt

    Figure 9 chart of U.S. search intensity related to artificial intelligence
    Figure 9. Search intensity related to AI in the United States (Google Trends).
    The University of South Carolina AI Index / JULY 2024 
     13 
    the number of Democrats holding the same view.  
     
    GENERAL PERCEPTIONS ABOUT AI  
     
    Figure 8 Source: Summer 2024 USC AI Index. 
    Question - How much have you heard or read about 
    AI? 
    Despite the topic's omnipresence in 
    the media and the increased search 
    activity surrounding it, 31% of 
    respondents have either not heard at 
    all (6%) or have heard only a little (25%) 
    about AI. The survey results indicate 
    that only a minority of the population 
    (36%) acknowledges having heard a 
    significant amount about artificial 
    intelligence (AI). In comparison, 33% 
    report having heard a moderate amount. These findings suggest that, although AI is widely 
    discussed, a substantial portion of the population remains relatively uninformed about it. 
     
     
    Figure 9 The intensity of searches related to artificial intelligence (AI) has increased dramatically and exponentially in the 
    United States since November 2022, coinciding with the public launch of ChatGPT. Data provided by Google Trends clearly 
    illustrates this surge, reflecting a growing interest and curiosity about AI technologies among the American public. 
    6%
    25%
    33%
    14%
    22%
    0%
    5%
    10%
    15%
    20%
    25%
    30%
    35%
    Not at all A little A
    moderate
    amount
    A great
    deal
    A lot
    Only a minority have heard 
    something about the AI

    Source: page-015.txt

    The University of South Carolina AI Index / JULY 2024 
     14 
     
    Figure 10 Source: Summer 2024 USC AI 
    Index. Question - Overall, would you say 
    technology like Artificial Intelligence has had 
    a mostly positive effect on our society or a 
    mostly negative effect on our society? 
    The survey results regarding the 
    societal impact of artificial 
    intelligence (AI) technology 
    present a nuanced perspective. A 
    majority of respondents, 47%, 
    believe that AI has had a positive 
    effect on society, with 13% 
    considering it very positive and 
    34% somewhat positive.  
    However, 26% of respondents are 
    neutral, seeing AI's impact as 
    neither positive nor negative. On the other hand, 27% of respondents view AI's impact 
    negatively, with 20% identifying it as somewhat negative and 7% as very negative. These results 
    reflect a divided opinion on AI, and the age difference is essential in this division. Younger 
    respondents are more likely to view artificial intelligence (AI) as having a positive effect on 
    society compared to older age groups. Among the 18-24-year-olds, 57% believe AI has a 
    positive impact. In contrast, only 35% of respondents aged 65 and older share this positive 
    view. 
     
    Figure 11 Source: Summer 2024 USC AI Index. Question - Overall, would you say technology like Artificial Intelligence has 
    had a mostly positive effect on our society or a mostly negative effect on our society? 
    57% 62%
    45% 55%
    36% 35%
    25% 17%
    25% 21%
    33% 38%
    18-24 years old 25-34 years old 35-44 years old 45-54 years old 55-64 years old 65+ years old
    As age increases, the perception of AI's negative 
    effects also rises
    Subtotal: POSITIVE Subtotal: NEGATIVE
    13%
    34%
    26%
    20%
    7%
    0%
    5%
    10%
    15%
    20%
    25%
    30%
    35%
    40%
    Very
    positive
    effect
    Somewhat
    positive
    effect
    Neither
    positive or
    negative
    Somewhat
    negative
    effect
    Very
    negative
    effect
    So far,  Artificial Intelligence has 
    had a mostly positive effect on 
    our society

    Source: page-016.txt

    The University of South Carolina AI Index / JULY 2024 
     15 
    Older individuals are more skeptical about the benefits of AI, highlighting a generational divide 
    in attitudes towards this technology. Similarly, we observe differences in perception across 
    other categories. Negative perceptions of AI are more prevalent among individuals with lower 
    incomes and those without higher education. These groups are more likely to view AI's impact 
    as somewhat or very negative, suggesting that socioeconomic factors play a significant role in 
    shaping attitudes towards AI. 
     
     
    Figure 12 Source: Summer 2024 USC AI Index. 
    Question - Overall, would you say the increased use 
    of artificial intelligence tools in daily life makes you 
    feel… 
    The survey reveals mixed feelings about 
    the increased use of artificial 
    intelligence (AI) tools in daily life. While 
    48% of respondents feel equally 
    concerned and excited, 35% are more 
    concerned than excited. These 
    concerns increase with age, lack of 
    education, and economic disparities, 
    highlighting the need to address these 
    issues to foster a more balanced 
    perspective on AI in the future. Only 
    17% of respondents feel more excited than concerned.   


    17%
    48%
    35%
    0%
    10%
    20%
    30%
    40%
    50%
    60%
    More excited than
    concerned
    Equally concerned
    and excited
    More concerned
    than excited
    Mixed feelings about the 
    increased use of AI

    Back to contents

  • CHATGPT & other AI tools

    CHATGPT & other AI tools

    CHATGPT & other AI tools

    Source: page-017.txt

    Section cover for ChatGPT and other AI tools
    The University of South Carolina AI Index / JULY 2024 
     16 


    CHATGPT & OTHER  AI TOOLS  
     
    The survey indicates that awareness of ChatGPT, a generative AI 
    tool, varies significantly among respondents. While 25% of the 
    public has heard a moderate amount about AI tools, half of the 
    sample, 50%, has either heard only a little (33%) or nothing at all 
    (17%).

    Source: page-018.txt

    The University of South Carolina AI Index / JULY 2024 
     17 
     
    Figure 13 Source: Summer 2024 USC AI Index. 
    Question - How much, if anything, have you 
    heard about ChatGPT, an artificial intelligence 
    (AI) tool used to create text? 
    In contrast, among younger 
    individuals, the number of those 
    who have heard about AI tools (more 
    specific, about ChatGPT) is double 
    compared to the sample average, 
    highlighting a significant 
    generational gap in awareness and 
    familiarity with generative AI 
    technologies. 
     
     
    Figure 14 Source: Summer 2024 USC AI Index. Question - Do you think it is acceptable for professionals to use ChatGPT or 
    other AI tools for... 
     
    The survey results indicate varying levels of acceptance for professionals using ChatGPT or 
    other AI tools. A significant majority, 73%, find it acceptable for translation or summarization 
    tasks, while 64% support using AI for generating ideas, and 60% for creating content for 
    communication. However, a notable minority remains skeptical, with 27% to 40% of 
    respondents not considering it acceptable. This skepticism is particularly pronounced among 
    those unfamiliar with these tools, reflecting a broader reticence towards AI among less 
    informed individuals. 
    64%
    73%
    60%
    36%
    27%
    40%
    0% 10% 20% 30% 40% 50% 60% 70% 80% 90% 100%
    Generating ideas
    Translation or summarization
    Creating content for communication
    Using AI for communication tasks is mostly accepted
    Yes No
    Not at all
    17%
    A little
    33%
    A moderate 
    amount
    25%
    A great deal
    8%
    A lot
    17%
    Half of the Americans have not 
    heard a lot about AI

    Source: page-019.txt

    The University of South Carolina AI Index / JULY 2024 
     18 
     
    Figure 15 Source: Summer 2024 USC AI Index. Question - Do you think it is acceptable for professionals to use ChatGPT or 
    other AI tools for...Results for people who thinks that AI has either a positive or negative effect in our society. 
     
    61%
    22%
    55%
    25%
    59%
    29%
    14%
    52%
    20%
    48%
    14%
    48%
    0%
    10%
    20%
    30%
    40%
    50%
    60%
    70%
    80%
    90%
    100%
    Yes, for
    Generating ideas
    No, for
    Generating ideas
    Yes, for
    Translation or
    summarization
    No, for
    Translation or
    summarization
    Yes, for Creating
    content for
    communication
    No, for Creating
    content for
    communication
    Those who trust the positive impact of AI are more 
    likely to agree with its use for various tasks
    Positive effect of AI in society Negative effect of AI in society

    Using AI tools for different tasks

    Source: page-020.txt

    The University of South Carolina AI Index / JULY 2024 
     19 
    USING  AI TOOLS FOR DIFFERENT TASKS  
     
     
    Figure 16 Source: Summer 2024 USC AI 
    Index. Question - Have you ever used 
    ChatGPT or other AI assistants to help with 
    your work or study? 
    The survey reveals that 38% of 
    respondents have used AI tools 
    like ChatGPT for work or study 
    purposes. This includes 12% who 
    have used it for work, 10% for 
    studying, and 15% for both work 
    and studying. Usage is above 
    average among younger 
    individuals, people from the 
    Western region of the United States, and those with medium to high income levels. This 
    demographic insight suggests that familiarity and comfort with AI tools are higher among these 
    specific groups. 
     
    Figure 17 Source: Summer 2024 USC AI Index. Question - Have you ever used ChatGPT or other AI assistants to help with your 
    work or study? Responses for each age group in the sample 
    13% 22%
    26%
    14%
    19%
    6%
    37% 28% 9%
    9%
    9%
    7%
    17%
    24%
    18%
    26% 10%
    4%
    0%
    10%
    20%
    30%
    40%
    50%
    60%
    70%
    80%
    90%
    100%
    18-24 years old 25-34 years old 35-44 years old 45-54 years old 55-64 years old 65+ years old
    Usage of AI is higher among young generations
    Yes, for work Yes, for studying Yes, for both work and studying No, I have not done this
    12% 10%
    15%
    63%
    0%
    10%
    20%
    30%
    40%
    50%
    60%
    70%
    Yes, for work Yes, for studying Yes, for both
    work and
    studying
    No, I have not
    done this
    38% of respondents have used AI 
    tools like ChatGPT

    ChatGPT vs. other AI assistants

    Source: page-021.txt

    The University of South Carolina AI Index / JULY 2024 
     20 
     
     
    Figure 18 Source: Summer 2024 
    USC AI Index. Question - What are 
    the main barriers to adopting AI in 
    your work or study? Choose the 
    most important one… 
    Among the reasons cited 
    by those who have not 
    used AI tools, the dominant 
    argument is a lack of trust, 
    mentioned by 46% of 
    respondents. This is 
    followed by a lack of skills, 
    noted by 24%. The cost is a 
    concern for only 9%, likely 
    because many of these 
    tools are currently 
    available for free. This 
    means that lack of trust 
    and knowledge are the primary barriers to AI adoption, rather than financial constraints. 
     
    CHATGPT VS. OTHER AI ASSISTANTS  
     
    Figure 19 Source: Summer 2024 USC AI 
    Index. Question - Which type of AI 
    assistant have you used? (Select all that 
    apply) 
    The survey results show that 
    ChatGPT dominates the usage 
    among AI assistants, with 29% 
    of respondents reporting having 
    used it. Usage is higher across 
    all active age groups. Google 
    Gemini (or Bard) and Microsoft 
    Copilot (or Bing) are used by 
    13% and 11% of respondents, 
    respectively. Notably, these 
    tools are more commonly used 
    Cost
    9%
    Complexity
    8%
    Lack of skills
    24%
    Lack of trust
    46%
    Other (specify)
    13%
    Trust and knowledge play a role in AI 
    adoption
    29%
    13%
    11%
    3%
    2%
    0%
    5%
    10%
    15%
    20%
    25%
    30%
    35%
    ChatGPT Google
    Gemini (or
    Bard)
    Microsoft
    Copilot (or
    Bing)
    Anthropic
    Claude
    Other
    (specify)
    ChatGPT dominates the usage 
    among AI assistants

    AI tools across industries

    Source: page-022.txt

    The University of South Carolina AI Index / JULY 2024 
     21 
    by individuals aged 45-55 and those working in engineering and scientific industries. Anthropic 
    Claude is used by 3%, and other AI assistants account for 2% of the usage. These trends 
    highlight ChatGPT's broad appeal and the specific preferences for other AI tools within certain 
    professional demographics. 
     
    AI TOOLS ACROSS INDUSTRIES  
     
    Figure 20 Source: Summer 2024 USC AI Index. The results of using different types of AI tools, for different industries 
    These findings highlight that professionals in science and technology are the most frequent 
    users of AI tools, followed by those in sales, communication, and finance sectors. This 
    distribution reflects the varying needs and adoption rates of AI technologies across different 
    fields. 
    23%
    30%
    20%
    37%
    39%
    31%
    48%
    61%
    47%
    53%
    6%
    4%
    8%
    13%
    18%
    18%
    12%
    14%
    17%
    34%
    5%
    6%
    11%
    12%
    10%
    18%
    5%
    3%
    15%
    28%
    0% 20% 40% 60% 80% 100% 120% 140%
    Services (e.g., restaurant, caretakers, tourism etc)
    Creative Arts (e.g., art, design, entertainment, music)
    Education and Training (e.g., teaching, educational
    content creation)
    Production and Manufacturing (e.g., agriculture, industrial
    production, manufacturing)
    Legal and Administrative (e.g., legal services,
    administrative support)
    Healthcare and Wellness (e.g., medical services, mental
    health)
    Finance and Banking (e.g., banking, investment, insurance)
    Communication and Media (e.g., journalism, public
    relations, broadcasting)
    Sales and Marketing (e.g., retail, advertising, market
    research)
    Science and Engineering (e.g., research and development,
    engineering)
    AI assistant distribution accross industries
    ChatGPT Google Gemini (or Bard) Microsoft Copilot (or Bing) Anthropic Claude

    Source: page-023.txt

    The University of South Carolina AI Index / JULY 2024 
     22 
     
    Figure 21 Source: Summer 2024 USC AI Index. Level of use of 4 AI tools & level of satisfaction with using this AI 
    The survey results indicate varying levels of satisfaction with different AI assistants when 
    recalculating the proportions of dissatisfied users. 
    - ChatGPT: 29% of respondents have used it, with 22% expressing satisfaction. This 
    leaves 7% who are dissatisfied, which translates to 24% of ChatGPT users. 
    - Google Gemini (or Bard): 13% have used it, with 9% satisfaction, leaving 4% 
    dissatisfied, or approximately 30% of its users. 
    - Microsoft Copilot (or Bing): 11% of respondents have used it, with 9% satisfaction, 
    resulting in 2% dissatisfaction, or about 18% of its users. 
    - Anthropic Claude: 3% have used it, with 1% satisfaction, leaving 2% dissatisfied, 
    translating to approximately 67% of its users. 
    Among these four AI tools, Microsoft Copilot has the lowest proportion of dissatisfied users 
    at 18%, indicating the highest overall user satisfaction compared to the other AI assistants. 


    ChatGPT Google Gemini
    (or Bard)
    Microsoft
    Copilot (or
    Bing)
    Anthropic
    Claude
    Type of AI assistant used 29% 13% 11% 3%
    Satisfaction with using this AI 22% 9% 9% 1%
    29%
    13% 11%
    3%
    22%
    9% 9%
    1%
    0%
    5%
    10%
    15%
    20%
    25%
    30%
    35%
    Microsoft Copilot has the lowest proportion of 
    dissatisfied users

    The effects & challanges of using AI tools

    Source: page-024.txt

    The University of South Carolina AI Index / JULY 2024 
     23 
    THE EFFECT S & CHALLANGES OF USING AI TOOLS  
     
    Figure 22 Source: Summer 2024 USC 
    AI Index. Question - How has this AI 
    assistant affected your productivity 
    at work or study? 
    The survey results indicate 
    that AI tools have generally 
    improved productivity for 
    about two-thirds of the 
    respondents. For ChatGPT 
    users - 68% reported 
    increased productivity. For 
    Google Gemini users: 75% 
    experienced improved 
    productivity. And for 
    Microsoft Copilot users: 76% saw productivity gains. This suggests that those who have used AI 
    tools report higher productivity scores overall. Among these tools, Microsoft Copilot users 
    reported the highest improvement in productivity. This indicates a strong correlation between 
    the use of AI assistants and perceived enhancements in work or study efficiency. 
     
     
    Significantly 
    improved
    22%
    Somewhat 
    improved
    42%
    Somewhat 
    worsened
    11%
    Significantly 
    worsened
    1%
    Neither 
    improved or 
    worsened
    24%
    64% of people experienced increased 
    productivity with AI

    Source: page-025.txt

    The University of South Carolina AI Index / JULY 2024 
     24 
     
    Figure 23 Source: Summer 2024 USC AI Index. Question - Have you faced any of the following challenges in integrating AI into 
    your work or study? (Select all that apply) 
     
    The survey results indicate that the most common challenges in integrating AI into work or 
    study involve the complexity of requests and the need for constant corrections, each cited by 
    13% of respondents. This suggests that users (those responding) already have some experience 
    using these tools. 12% mentioned that AI does not understand or respond appropriately to 
    complex requests. Other issues include AI not being reliable (7%), responding too slowly (6%), 
    not maintaining privacy or confidentiality (5%), and hallucinating (inventing stuff that is not real) 
    (5%). Younger respondents provided more answers to this question than older respondents, 
    confirming that the newer generations use these tools more extensively. This trend highlights 
    the growing adoption of AI tools among younger demographics, who are more likely to 
    encounter and report these challenges. 
     
     
    0%
    5%
    5%
    6%
    7%
    12%
    13%
    13%
    0% 2% 4% 6% 8% 10% 12% 14%
    Other (please specify)
    AI is hallucinating (inventing stuff that is not real)
    AI does not maintain privacy or confidentiality
    AI responds too slowly
    AI is not reliable
    AI does not understand or respond appropriately to
    complex requests
    AI responses need a lot of correcting
    I have not experienced any challenges
    Main challenges when using AI for work or study

    Using AI tools for communication

    Source: page-026.txt

    The University of South Carolina AI Index / JULY 2024 
     25 
    USING AI TOOLS FOR COMMUNICATION  
    When examining the differences across 
    industries, notable variations emerge. 
    Communication and Media lead the 
    way, with 71% of respondents using AI 
    tools for content creation. This high 
    engagement might suggest the 
    industry's reliance on AI for enhancing 
    productivity. Half of those working in 
    communications and media admit to 
    using these AI tools daily, highlighting 
    their integral role in the industry. The 
    trend reflects the industry's rapid 
    adoption and integration of AI 
    technologies. 
     
     
    Figure 25 Source: Summer 2024 USC AI Index. Question - Have you ever used ChatGPT or other AI assistants to help with 
    creating communication content? 
     
    Services follow with 50%, indicating a balanced adoption rate for content creation purposes. In 
    Science and Engineering, 47% have utilized AI tools. In contrast, Healthcare and Wellness 
    13%
    25%
    27%
    28%
    33%
    36%
    37%
    39%
    46%
    47%
    50%
    71%
    87%
    75%
    73%
    72%
    67%
    64%
    63%
    61%
    54%
    53%
    50%
    29%
    0% 10% 20% 30% 40% 50% 60% 70% 80% 90% 100%
    Other industry
    Healthcare and Wellness
    Education and Training
    NATIONAL AVERAGE
    Creative Arts
    Finance and Banking
    Legal and Administrative
    Production and Manufacturing
    Sales and Marketing
    Science and Engineering
    Services
    Communication and Media
    Differences in adopting AI tools for industries
    Yes (for work/study) No, I have not done this
    11%
    8%
    9%
    72%
    0% 20% 40% 60% 80%
    Yes, for work
    Yes, for studying
    Yes, for both work and
    studying
    No, I have not done this
    28% have used ChatGPT or other 
    AI assistants to help create 
    communication content
    Figure 24 Source: Summer 2024 USC AI Index. Question - Have you 
    ever used ChatGPT or other AI assistants to help with creating 
    communication content?

    Source: page-027.txt

    The University of South Carolina AI Index / JULY 2024 
     26 
    show a lower adoption rate at 25%. Similarly, in Education and Training, where the 
    respondents were primarily educators and not students, only 27% admitted that they have used 
    AI tools, suggesting a cautious approach towards AI in educational content creation. Thus, 
    while AI is embraced in certain industries for its productivity and creative potential, others 
    remain hesitant, potentially due to specific industry challenges or concerns. 


    Figure 26 Source: Summer 2024 USC AI 
    Index. Question - Have you ever used 
    ChatGPT or other AI assistants to help with 
    creating communication content?  
    The survey reveals that students 
    are the primary beneficiaries of 
    AI tools like ChatGPT, with 61% 
    using them for creating 
    communication content. 
    Following closely are white-
    collar professionals, such as 
    office workers and managers, 
    with 40% utilizing these tools. 
    Blue-collar workers also show 
    notable usage at 45%, indicating 
    that AI tools are beneficial across 
    a range of professions. In 
    contrast, homemakers (16%), 
    the unemployed (9%), and 
    retirees (9%) report significantly 
    lower usage rates, highlighting a 
    clear divide in AI tool adoption 
    based on occupation.  
    9%
    9%
    16%
    28%
    29%
    40%
    45%
    61%
    91%
    91%
    84%
    72%
    71%
    60%
    55%
    39%
    0% 20% 40% 60% 80% 100%
    Retired
    Unemployed
    Homemaker
    NATIONAL AVERAGE
    Freelancer (independent
    contractor, gig worker)
    White-collar professional (e.g.,
    office worker, manager,
    professional)
    Blue-collar worker (e.g., manual
    labor, tradesperson)
    Student
    Differences in adopting AI tools for 
    occupations
    Yes (for work/study) No, I have not done this

    Source: page-028.txt

    The University of South Carolina AI Index / JULY 2024 
     27 
     
    Figure 27 Source: Summer 2024 USC AI Index. Among the 28% of respondents who reported using AI tools like ChatGPT - 
    What types of communication-related tasks do you use ChatGPT or other AI assistants for? (Select all that apply). 292 
    responses (people who used AI tools for communication content) 
     
    This data reflects the diverse applications of AI tools among users who regularly incorporate 
    them into their workflows, focusing mainly on idea generation and summarizing content. More 
    complex tasks like programming or art generation are a target for a much smaller group of 
    respondents. 
     
     
    1%
    5%
    5%
    6%
    6%
    6%
    7%
    8%
    8%
    13%
    15%
    0% 2% 4% 6% 8% 10% 12% 14% 16%
    Other (specify)
    Programming (e.g., code, software development)
    Art (e.g., digital art, illustrations)
    Web or blog articles
    Scripts for videos or reports
    Writing press releases
    Creating bulletpoints for some concepts
    Email campaigns
    Writing social media posts
    Summarising links or longer texts
    Generating ideas
    Main uses for AI tools

    Source: page-029.txt

    The University of South Carolina AI Index / JULY 2024 
     28 
     
    Figure 28 Source: Summer 2024 USC AI Index. Question - How effective do you find AI assistants in aiding your content 
    creation process for communication tasks? 292 responses (people who used AI tools for communication content) 
     
    Among those who reported using AI tools for content creation, nearly half (48%) consider them 
    to be effective, while 30% find them moderately effective. Only 22% of users are dissatisfied, 
    deeming the tools not effective. This indicates that a significant majority of users appreciate the 
    value and efficiency AI assistants bring to their communication tasks, so far. 
     
     
    NOT EFFECTIVE, 
    22%
    EFFECTIVE, 48%
    Moderately 
    effective, 30%
    Most users appreciate the AI tools as effective

    Back to contents

  • The future of jobs in communication

    The future of jobs in communication

    The future of jobs in communication

    Source: page-030.txt

    Section cover for future of jobs in communication
    The University of South Carolina AI Index / JULY 2024 
     29 


    THE FUTURE OF JOBS IN  
    COMMUNICATION,  
    WITH MORE INFLUENCE OF AI ASSISTANTS  
     
    The survey reveals mixed expectations about the impact of AI on 
    jobs in the communication field. Half of the respondents (52%) 
    fear that AI will reduce the number of jobs due to task 
    automation.

    Ethical considerations in using AI tools

    Source: page-031.txt

    The University of South Carolina AI Index / JULY 2024 
     30 
     
    Figure 29 Source: Summer 2024 USC 
    AI Index. Question - Considering the 
    increasing use of AI assistants in 
    tasks like writing emails, creating 
    content, or managing social media, 
    how do you think these technologies 
    will affect jobs in the communication 
    field? 
    Meanwhile, 29% expect AI to 
    transform existing jobs, 
    requiring new skills and 
    changing job roles. 
    Additionally, 13% believe AI 
    will create more jobs by 
    enhancing human 
    capabilities and opening 
    new opportunities.  
    Overall, a dominant portion 
    of respondents anticipates 
    significant changes, whether 
    through job reduction or 
    transformation. Only a small minority (6%) believes that AI will have no significant impact on 
    jobs in the communication field. Interestingly, older respondents are much more likely than the 
    average to think that AI tools will have no influence on jobs in this domain, highlighting a 
    generational divide in perceptions about the future of AI in the workplace. 
     
     
    ETHICAL CONSIDERATIONS IN USING AI TOOLS  
     
    Figure 30 Source: Summer 2024 USC AI Index. Questions about the privacy and ethical problems. 
    31%
    12%
    27%
    69%
    88%
    73%
    0%
    10%
    20%
    30%
    40%
    50%
    60%
    70%
    80%
    90%
    100%
    Do you use AI for creating content
    for personal use? (e.g., personal
    projects, learning or entertainment)
    Have you encountered any privacy
    issues with AI assistants, so far?
    Are you aware of ethical guidelines or
    best practices for AI use in your field?
    Yes No
    13%
    29%
    52%
    6%
    0%
    10%
    20%
    30%
    40%
    50%
    60%
    AI will create
    more jobs by
    enhancing human
    capabilities and
    opening up new
    opportunities
    AI will transform
    existing jobs,
    requiring new
    skills and changing
    job roles
    AI will reduce the
    number of jobs,
    as many tasks will
    become
    automated
    AI will have no
    significant impact
    on jobs in the
    communication
    field
    Mixed expectations for the future, in the 
    communication field

    AI helps or hurts?

    Source: page-032.txt

    The University of South Carolina AI Index / JULY 2024 
     31 
    The results indicate that a significant portion of the public has mixed views regarding the ethical 
    use of AI. Only 12% have encountered privacy issues with AI assistants and 27% of the 
    respondents are aware of ethical guidelines or best practices for AI use in their field. The survey 
    reveals that women and those with higher education levels are more likely to consider AI as 
    unethical. Conversely, individuals working in science and technology, as well as the male 
    demographic, are less concerned about AI ethics, indicating a potential divide in ethical 
    considerations based on gender, education, and professional background. 
     
    Figure 31 Source: Summer 2024 USC AI Index. Question - How much do you believe that AI will act according to ethical 
    standards and values? (With 1 being lowest and 100 being highest, assigning any number in between to represent your 
    confidence in AI ethics) Average – 46.5 
     
    AI HELPS OR HURTS ? 
     
    Figure 32 Source: Summer 2024 USC AI Index. Questions about the effect of AI for different tasks 
    19%
    18%
    28%
    22%
    13%
    0%
    5%
    10%
    15%
    20%
    25%
    30%
    0-19 20-39 40-60 61-80 81-100
    Y our confidence in AI ethics
    36%
    38% 38%
    43%
    34% 35%
    21%
    28% 27%
    0%
    5%
    10%
    15%
    20%
    25%
    30%
    35%
    40%
    45%
    50%
    For people finding accurate
    information online
    For people doing their jobs more
    creatively
    For students learning better
    The efect of AI - mixed perceptions, with more people having 
    positive attitudes about the influence of AI
    AI helps more that it hurts Not sure AI hurts more than it helps

    Source: page-033.txt

    The University of South Carolina AI Index / JULY 2024 
     32 
    Overall, the public remains divided on AI's benefits and drawbacks. Interestingly, men tend to 
    have a more positive view of AI's impact, but the balance of opinions is relatively consistent 
    across different demographic groups, which might suggest a nuanced understanding of AI's 
    potential and challenges among the broader population.

    Back to contents

  • The effect of AI in journalism and politics

    The effect of AI in journalism and politics

    The effect of AI in journalism and politics

    Source: page-034.txt

    Section cover for AI in journalism and politics
    The University of South Carolina AI Index / JULY 2024 
     33 


    THE EFFECT OF AI IN 
    JOURNALISM AND POLITICS  
    The survey indicates a divided outlook on AI's influence on the 
    quality of journalism, with positive influence for 46%, negative 
    influence for 36%, and no significant impact - for 18%. 
    Interestingly, skepticism about AI's role in journalism increases 
    with higher education levels and age, suggesting that more 
    educated and older respondents are more cautious about the 
    potential negative effects of AI on journalistic quality.

    Source: page-035.txt

    The University of South Carolina AI Index / JULY 2024 
     34 
     
    However, the overall sentiment remains somewhat positive, with a larger portion of the 
    population leaning towards the belief that AI will enhance rather than undermine journalism 
    quality. 
     
    Figure 33 Source: Summer 2024 USC AI Index. Questions about the AI tools and the quality of journalism 
     
    When discussing the impact of AI on specific areas, the survey results reveal mixed opinions 
    among the public. 
     
    12%
    34%
    23%
    13%
    18%
    0%
    5%
    10%
    15%
    20%
    25%
    30%
    35%
    40%
    Strongly influences for
    the better
    Moderately influences
    for the better
    Moderately influences
    for the worse
    Strongly influences for
    the worse
    No significant impact
    T o what extent do you believe AI can influence the 
    quality of journalism for better or for worse?

    Source: page-036.txt

    The University of South Carolina AI Index / JULY 2024 
     35 
     
    Figure 34 Source: Summer 2024 USC AI 
    Index. Question - To what extent AI do you 
    think can contribute to online 
    misinformation and disinformation? 
    The concern about AI increasing 
    online misinformation is 
    evident, with 46% believing that 
    AI will heighten misinformation. 
    Conversely, 33% think AI might 
    reduce misinformation, while 
    21% believe AI's impact will be 
    neutral. The trend shows that 
    younger respondents feel less 
    at risk from misinformation, 
    potentially indicating a gap in 
    awareness about the dangers of 
    AI-generated content. Educated 
    individuals, on the other hand, 
    show greater apprehension about the rise of misinformation due to AI. 
     
    Figure 35 Source: Summer 2024 USC 
    AI Index. Question - Do you believe 
    that AI-generated content has the 
    potential to influence political 
    views, especially in the context of 
    future elections? 
    A significant portion of 
    respondents believe AI-
    generated content could 
    influence political views, 
    particularly in the context of 
    future elections. 
    Specifically, 61% (37% 
    "probably yes" and 24% 
    "definitely yes") think it has 
    this potential. Only a small 
    fraction, 13%, dismiss this 
    possibility ("definitely not" 
    and "probably not"). Again, notably, younger individuals feel less exposed to the influence of AI-
    generated content on political views, possibly making them more vulnerable to subtle 
    manipulations. In contrast, those with higher education levels are more aware and concerned 
    about such influences. 
    These insights underline the complexity of public perceptions regarding AI's role in influencing 
    information and politics. They highlight the need for heightened awareness and education, 
    especially among younger demographics, to better navigate the potential pitfalls of AI in 
    shaping opinions and disseminating information.  
    3%
    10%
    37%
    24%
    26%
    0%
    5%
    10%
    15%
    20%
    25%
    30%
    35%
    40%
    Definitely not Probably not Probably yes Definitely yes Neutral
    Potential to influence political views
    33%
    46%
    21%
    0%
    5%
    10%
    15%
    20%
    25%
    30%
    35%
    40%
    45%
    50%
    Reduces dis &
    misinformation
    Increases dis &
    misinformation
    AI has a neutral effect
    Contribution to the 
    misinformation and 
    disinformation

    Source: page-037.txt

    The University of South Carolina AI Index / JULY 2024 
     36 
    Also, public perceptions on the government's role in regulating AI tools like ChatGPT are 
    notably mixed. According to the survey, 26% worry that the government might over-regulate, 
    potentially stifling innovation and the beneficial applications of AI. The self-labeled Republicans 
    are even more concerned than the average American (40%).  
    Conversely, 38% of respondents are concerned that the government will not go far enough in 
    regulating the use of AI, indicating a desire for more stringent oversight to manage potential 
    risks and ethical considerations. Self-labeled Democrats are interested in a higher regulation in 
    proportion of 48%.  
     
    Figure 36 Source: Summer 2024 USC AI Index. Question - As chatbots like ChatGPT become more widespread, which is your 
    greater concern of the following? 
     
    20%
    40%
    26%
    32%
    29%
    36%
    48%
    31%
    38%
    0% 10% 20% 30% 40% 50% 60% 70% 80% 90% 100%
    Democrat
    Republican
    AVERAGE SAMPLE
    Government will go too far regulating their use
    Neither. I am not sure
    Government will not go far enough regulating their use

    Confidence in institutions & MEDIA

    Source: page-038.txt

    The University of South Carolina AI Index / JULY 2024 
     37 
    CONFIDENCE IN INSTITUTIONS  & MEDIA  
     
    Figure 37 Source: Summer 2024 USC AI Index. Questions about the level of confidence in institutions. Results are presented 
    in order of the average score (higher average in top) 
     
    The data on institutional trust shows a clear hierarchy, with universities enjoying the 
    highest levels of confidence from the public, followed by YouTube, news websites, and 
    10%
    8%
    10%
    12%
    9%
    5%
    9%
    13%
    10%
    10%
    11%
    14%
    14%
    8%
    12%
    11%
    12%
    14%
    16%
    16%
    19%
    18%
    21%
    20%
    17%
    24%
    22%
    28%
    27%
    29%
    34%
    36%
    35%
    30%
    44%
    40%
    40%
    41%
    37%
    27%
    25%
    20%
    27%
    26%
    26%
    23%
    17%
    19%
    17%
    20%
    19%
    15%
    33%
    28%
    33%
    20%
    18%
    16%
    17%
    21%
    9%
    13%
    9%
    9%
    10%
    0% 10% 20% 30% 40% 50% 60% 70% 80% 90% 100%
    TikTok
    X or Twitter
    The Republican Party
    Facebook
    The Government
    Major Corporations
    The press
    The Democratic Party
    Business in general
    Television news
    News websites
    YouTube
    Universities
    Level of confidence in institutions 
    A great deal Quite a lot A moderate amount Not very much No confidence at all

    Source: page-039.txt

    Figure 38 PCA chart showing trust profile clustering across U.S. institutions
    Figure 38. Principal Component Analysis of trust in institutions and media.
    The University of South Carolina AI Index / JULY 2024 
     38 
    television news. Conversely, TikTok is at the bottom of the trust scale, indicating 
    significant skepticism about this platform. Among social media channels, YouTube 
    stands out as the most trusted, reflecting its perceived reliability and influence. 
     
    The principal component analysis (PCA) in the second graph further elucidates the 
    public's trust patterns. It reveals distinct clusters of trust in various institutions. This 
    analysis helps understanding the underlying patterns of trust among different 
    demographic groups. For instance, there are clear divisions between those who trust 
    traditional institutions like universities, TV news, and government and those who place 
    their trust in newer, digital platforms like X, TikTok or YouTube. The PCA plot provides a 
    visual representation of these trust dynamics, highlighting the diverse trust profiles 
    within the surveyed population. 
     
    Figure 38 A Principal Component Analysis (PCA) of survey responses concerning trust in various U.S. institutions. Each point 
    represents an individual's trust levels, with the x-axis (PC1) capturing the most variance and the y-axis (PC2) showing the 
    second highest variance. Clusters indicate groups with similar trust profiles, while distances between points reflect 
    differences in trust levels. Institutions are depicted as vectors, showing their influence on the respondents' positions in the 
    PCA space. The length and direction of each vector indicate the strength and nature of the relationship between trust in that 
    institution and the principal components. This visualization reveals underlying patterns and distinct trust profiles among 
    different demographic or psychographic groups.

    Back to contents

  • Sampling, Credits

    Sampling, Credits

    Descriptives of the sample. Weighting

    Source: page-040.txt

    The University of South Carolina AI Index / JULY 2024 
     39 
    DESCRIPTIVES OF THE SAMPLE. WEIGHTING  
     
    The Summer 2024 USC AI Index was conducted June 27 – July 3, 2024, by the College of Information and 
    Communications at University of South Carolina, using Qualtrics panel respondents. This poll is based 
    on a nationally representative probability sample of 1,061 adults ages 18+. 
    The margin of sampling error is plus or minus 3 percentage points at the 95% confidence level, for results 
    based on the entire sample of adults. The margin of sampling error takes into account the design effect. 
    The margin of sampling error is higher and varies for results based on sub-samples. Sampling error is only 
    one potential source of error. There may be other unmeasured non-sampling errors in this or any poll. In 
    questions that permit multiple responses, columns may total substantially more than 100%, depending 
    on the number of different responses offered by each respondent. 
    The study was conducted in English. The data were weighted by age, gender, household income, Census 
    region, education, occupation, race/ethnicity. We did not weight the sample by vote.  
    The demographic benchmarks came from 2023 Current Population Survey (CPS) from the US Census 
    Bureau.  
     
     
    Age. How old are you?   
    Valid Percent  
     18-24 years old 12.0 
     25-34 years old 17.5 
     35-44 years old 16.0  
     45-54 years old 15.1 
     55-64 years old 16.6 
     65+ years old  22.9 
     
    Gender. How do you describe yourself?   
        Valid Percent  
     Male   50.3  
     Female   49.2  
     Other   .5  
     
    Region (based on ZIP Code & US Census)   
    Valid Percent  
     Midwest  21.0  
     Northeast  17.0  
     South   38.0  
     West   24.0  
     
    Education. What is the highest level of education you have completed?

    Source: page-041.txt

    The University of South Carolina AI Index / JULY 2024 
     40 
          Valid Percent  
     Some high school or less  9.0  
     High school diploma or GED  28.0  
     Some college, but no degree  15.0  
     Associates or technical degree 10.0  
     Bachelor’s degree   24.0  
     Graduate or professional degree  
    (MA, MS, MBA, PhD, JD, MD, DDS etc.)  14.0  
      
    Occupation. What best describes your current occupation? - Selected Choice 
          Valid Percent  
     Student    7.4  
     White-collar professional  30.0  
     Blue-collar worker   13.2  
     Freelancer    3.0  
     Retired     25.3  
     Homemaker    6.0  
     Unemployed    11.1  
     Other (please specify)   4.1  
     
    Income. What was your total household income before taxes during the past 12 months? 
          Valid Percent  
     Less than $25,000   17.1  
     $25,000-$49,999   19.8  
     $50,000-$99,999   28.3  
     $100,000-$199,999   27.4  
     More than $200,000   7.4  
     
    Race / ethnicity 
          Valid Percent  
     AmericanIndian&Other  7.4  
     Asian&Pacific    6.7  
     Black     11.1  
     Hispanic or Latino   18.5

    PHOTOGRAPHY CREDITS

    Source: page-042.txt

    The University of South Carolina AI Index / JULY 2024 
     41 
     Hawaiian or Other Pacific Islander 2.2  
     White     54.1  
     
     
    Figure 39 Source: Summer 2024 USC AI Index. Questions - In politics TODAY, do you consider yourself a Republican, 
    Democrat, or independent? Recoded categories 
     
    There is an increase proportion of independents and a lower ratio of Republicans, as 
    compared with other studies. We did not weight the sample, based on the vote or 
    political preferences. 


    PHOTOGRAPHY CREDITS  
    COVER: Steve Johnson/Unsplash 
    P. 2: Omar Houchaimi/Pexels 
    Pp. 3-4: Tara Winstead/Pexels 
    P. 7: Kevin Ku/Pexels 
    P: 17: Growtika/Unsplash 
    P. 29: Pavel Danilyuk/Pexels 
    P. 33: Pixabay/Pexels 
    Republicans
    33%
    Democrats
    49%
    Other
    18%
    Political option

    Back to contents